
Hello everyone, I am back! For those who don’t know, a couple of weeks ago I posted a survey which aimed at finding how players ranked all the bachelors and bachelorettes present in the game.
After waiting for the numbers to settle, and especially after seeing them do so painfully early, I decided to put together some results. I hope I’ll get to define them as “preliminary” if more people, seeing this, will decide to keep contributing.
I tried to describe the pictures briefly, highlighting the main interesting points of each graph without drawing any conclusion myself, since I want to leave it up to you to interpret them as you see fit. I’m just presenting you the facts, and I absolutely do not think my observations are in any way exhaustive.
If you haven’t done so yet, help me make this better by VOTING HERE!
Here is a quick summary of what I found:
RANKINGS BY TOTAL POPULATION
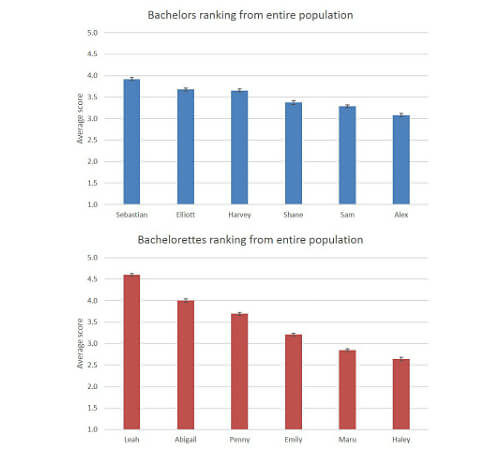
Bachelors:
- Sebastian
- Elliot
- Harvey
- Shane
- Sam
- Alex
Bachelorettes:
- Leah
- Abigail
- Penny
- Emily
- Maru
- Haley
DEMOGRAPHY GROUPS HIGHLIGHTS

- Alex is less popular with women and especially with non-binary people, while Sebastian follows the opposite trend; Sam is less popular with women, while Shane is less popular with men;
- Haley is especially unpopular with women, while Maru is more appreciated by them and the non-binary community;
- Alex is more popular with the gay community, and especially by men, while Elliott is more popular among heterosexuals, especially women. Shane is more unpopular among heterosexuals;
- Penny is more appreciated among heterosexuals;
- Asexual players seem to prefer Maru, while disliking Haley even more than the average population;
- Elliot, Harvey, Leah, and Maru seem to be more appreciated by older players, while Sam and Shane by younger ones.
As I said, I didn’t draw any conclusions, and I do not think my observations should be considered exhaustive. I encourage everyone to have a look at the graphs to let me know what they think the data means! Also, if you have any suggestions on how to improve anything at all, really, fire away. If more people end up contributing because of this, I’ll update the graphs so we can have a more accurate look at the community preferences!
Thank you to everyone who participated and as well as to who joined us now! You made me a very happy nerd!
Original Link – Continuation of discussion


Add comment